
HOW THE ‘FEAR FACTOR’ AFFECTS POLITICAL SURVEYS IN BELARUS
Can results of independent studies be skewed by respondents’ fear of answering political questions.
Director of "Belarusian initiative" of Chatham House and founder of Center for New Ideas
Ryhor Astapenia
Photo by Pavel Kritchko
Recently there has been increasing discussion of whether opinion polls in Belarus reflect reality. Mistrust of the authorities and their institutions makes the results of state polls unreliable in the eyes of Belarusians. While independent surveys have a more reliable reputation, some consider it impossible to conduct them in the current environment.
Moreover, some people think that even in properly conducted independent studies, results can be skewed by respondents’ fear of answering political questions.
In this chapter, an attempt will be made to assess to what degree fear influences the answers to certain questions. We used several different techniques in the study to stimulate respondents' sincerity and reduce anxiety.
Concerns about the effects of fear while taking a survey on political topics are justified:
About nine per cent of respondents stop doing the survey when they reach the question at the very beginning of the questionnaire: ‘Which position is closer to you?’ (Support for the protests, neutral, support for the current government). Some of the responses from respondents also speak of concern:
Respondents’ feedback after completing the survey:
We asked respondents how they thought others answered the questions: 'How sincerely do you think other people answered the questions in this study?’
According to Belarusians, other survey participants were honest in 69% of cases
It can be assumed that when answering the question, respondents proceeded from their own personal level of honesty.
Thus, it can be assumed that the share of insincere answers is too high to be ignored.
Moreover, some people think that even in properly conducted independent studies, results can be skewed by respondents’ fear of answering political questions.
In this chapter, an attempt will be made to assess to what degree fear influences the answers to certain questions. We used several different techniques in the study to stimulate respondents' sincerity and reduce anxiety.
Concerns about the effects of fear while taking a survey on political topics are justified:
About nine per cent of respondents stop doing the survey when they reach the question at the very beginning of the questionnaire: ‘Which position is closer to you?’ (Support for the protests, neutral, support for the current government). Some of the responses from respondents also speak of concern:
Respondents’ feedback after completing the survey:
- Annoying
- Questions about politics are alarming, may regret answering later
- This is a very sore topic for Belarusians...
- Good survey that counts on frank answers, but many of the questions are frankly dangerous to answer
- There are a lot of sensitive questions, I will remember this survey well
We asked respondents how they thought others answered the questions: 'How sincerely do you think other people answered the questions in this study?’
According to Belarusians, other survey participants were honest in 69% of cases
It can be assumed that when answering the question, respondents proceeded from their own personal level of honesty.
Thus, it can be assumed that the share of insincere answers is too high to be ignored.
The share of those who voted for Sviatlana Tsikhanouskaya in the elections in 2020 was estimated using the unmatched count technique (UCT).
Respondents were asked to select the number of statements they agree with:
Example question:
You will now be shown several statements. Please indicate the TOTAL NUMBER of statements that you believe to be true – i.e. a number from 0 to 5 (6). You don't need to specify which statements you agree with. If you agree with all five (six) statements, write 5 (6). If you only agree with one statement, write 1 (no matter which one it is), and so on.
Set of options for the first half of the sample:
Set of options for the second half of the sample includes all the statements above with one more option:
I voted for Sviatlana Tsikhanouskaya in the 2020 presidential elections
Respondents were asked to select the number of statements they agree with:
- Half of the sample (split randomly) were offered only neutral statements;
- The second half of the sample, in addition to neutral statements, also received a sensitive statement ‘I voted for Sviatlana Tsikhanouskaya in the 2020 presidential elections’.
- Taking into account the homogeneity of the sample, we compared the mean values of answers to a question consisting only of neutral statements with answers to one that includes a sensitive option.
- The difference in mean values corresponds to how often a sensitive answer was given by the general population (urban Belarusians with access to the internet).
Example question:
You will now be shown several statements. Please indicate the TOTAL NUMBER of statements that you believe to be true – i.e. a number from 0 to 5 (6). You don't need to specify which statements you agree with. If you agree with all five (six) statements, write 5 (6). If you only agree with one statement, write 1 (no matter which one it is), and so on.
Set of options for the first half of the sample:
- I own a car
- Yesterday I returned from a business trip in Australia
- My monthly salary is larger than BYN 1,000
- My phone number ends in a 1
- I brushed my teeth yesterday
Set of options for the second half of the sample includes all the statements above with one more option:
I voted for Sviatlana Tsikhanouskaya in the 2020 presidential elections
Methodology: UCT
UCT – Data analysis results
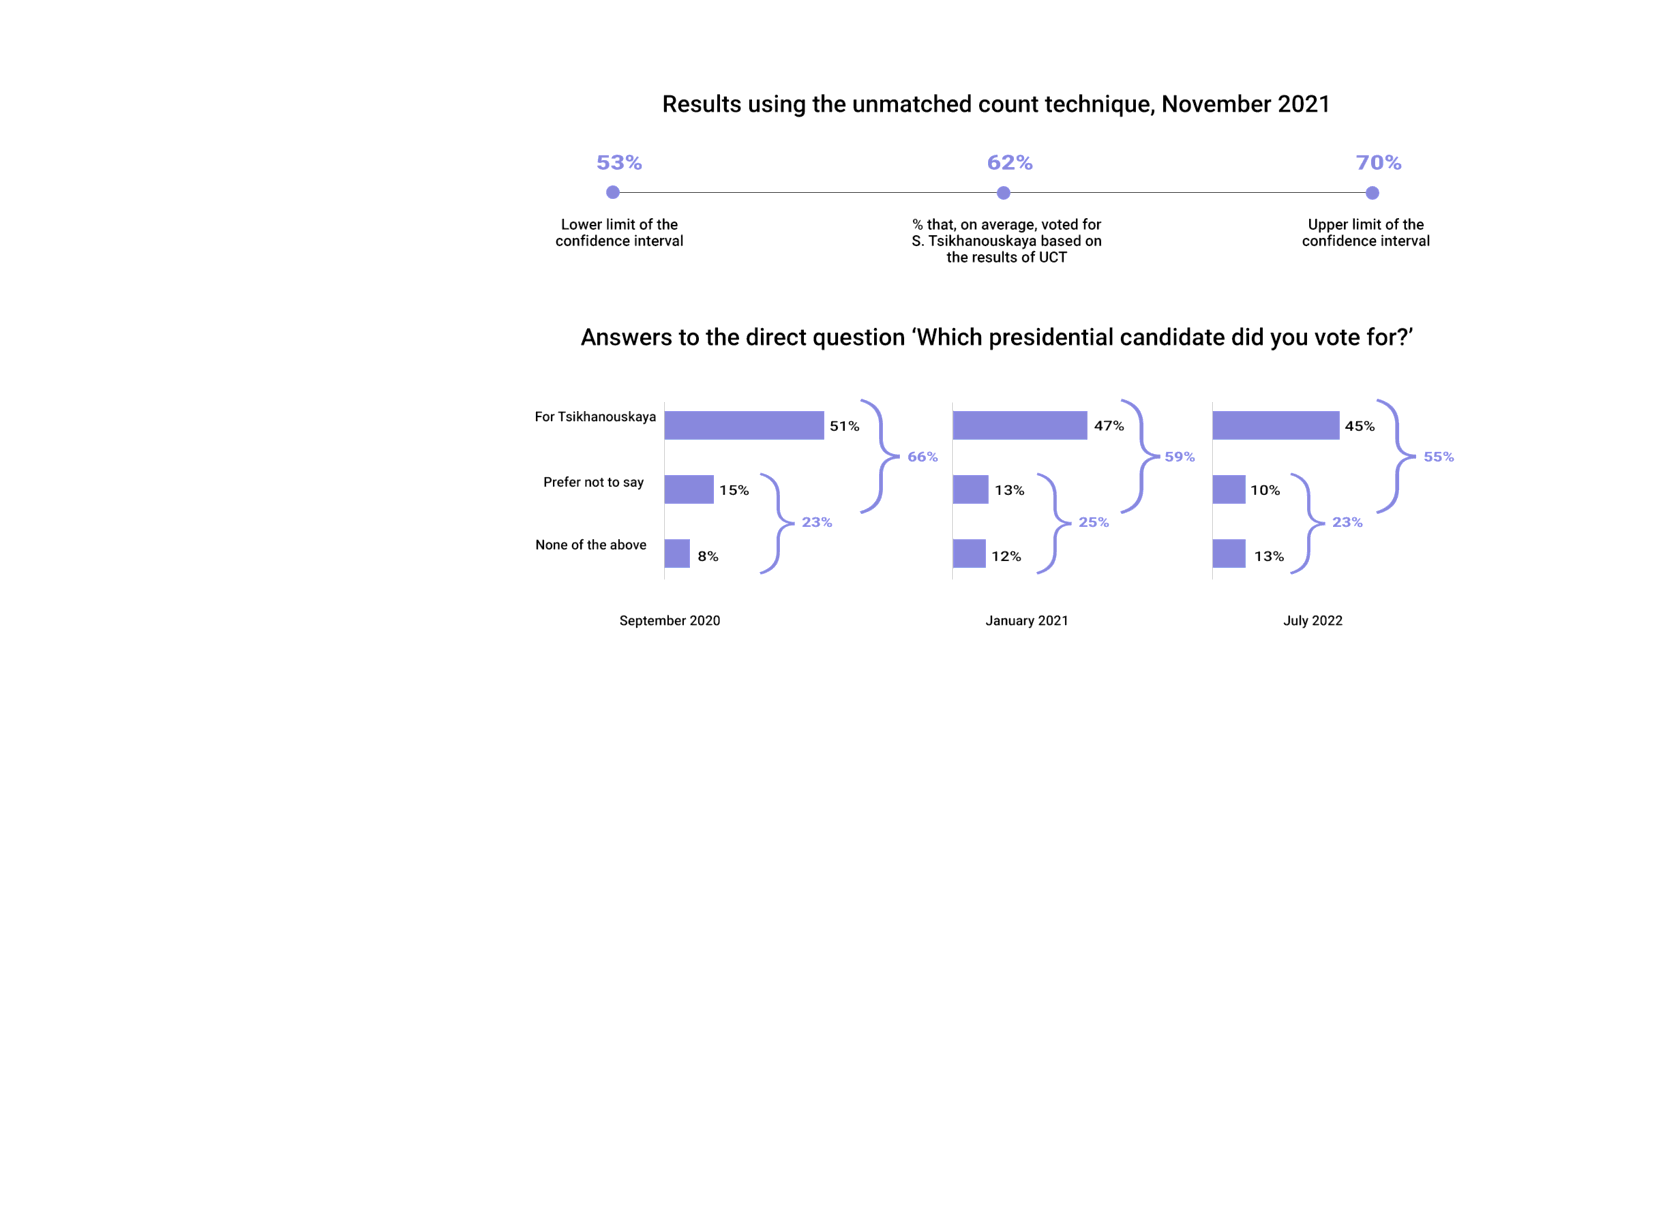
On average, 62% of urban Belarusians with internet access voted for S. Tsikhanouskaya.
With a 95% probability, the share of Tsikhanouskaya's supporters lies in the range from 53–70%.
With a 95% probability, the share of Tsikhanouskaya's supporters lies in the range from 53–70%.
- In September, the sum of the percentages of those who preferred not to say and who voted for S. Tsikhanouskaya (66%) was within the confidence interval (from 53 to 70%).
- Due to further political repression, people became more afraid to directly answer the question ‘Which presidential candidate did you vote for?’ – the share of answers ‘none of the above’ increased.
- At the same time, the sum of the percentages of those who preferred not to say, or who voted ‘none of the above’ remained approximately the same in all periods.
- There were also reasons for Belarusians to hide their opinions in September 2020 (when 15% of people did not answer the question), indicating that the fear factor was present even at that time. This means that the fear factor (hereafter FF) was ~ 2.7% in September 2020, and ~ 8.7% in July 2021.
- FF = Difference between UCT values and percentage of respondents to direct question, minus UCT standard error * 1.96 (outside of two standard deviations)
The share of those who participated in the protests was assessed using the randomized response technique* (crosswise model). The respondents had to mentally answer two questions, one of which was neutral, and the other of which is sensitive:
Depending on whether the answers to these questions coincided, they then had to select the option “different” or “the same”;
Example question
There are 2 questions on the screen. Answer these questions in your head, and then compare if your answers are different or the same. If you gave the same answers to both questions (for example, both ‘yes’ or both ‘no’), select ‘the same’ option. If your answer to one of the questions is ‘yes’, but ‘no’ to the other, select the option ‘different’.
Proceeding from the fact that the probability of being born in winter is known for neutrals and the hardcore protesters (0.25), and for representatives of Lukashenka’s base the probability of participating in the protests is zero, we calculated the proportion of those who took part in the protests by segment.
Depending on whether the answers to these questions coincided, they then had to select the option “different” or “the same”;
Example question
There are 2 questions on the screen. Answer these questions in your head, and then compare if your answers are different or the same. If you gave the same answers to both questions (for example, both ‘yes’ or both ‘no’), select ‘the same’ option. If your answer to one of the questions is ‘yes’, but ‘no’ to the other, select the option ‘different’.
- Were you born in winter?
- Did you take part in the protests in the summer–fall of 2020?
Proceeding from the fact that the probability of being born in winter is known for neutrals and the hardcore protesters (0.25), and for representatives of Lukashenka’s base the probability of participating in the protests is zero, we calculated the proportion of those who took part in the protests by segment.
Methodology – RRT (CM)
RRT – Data analysis results
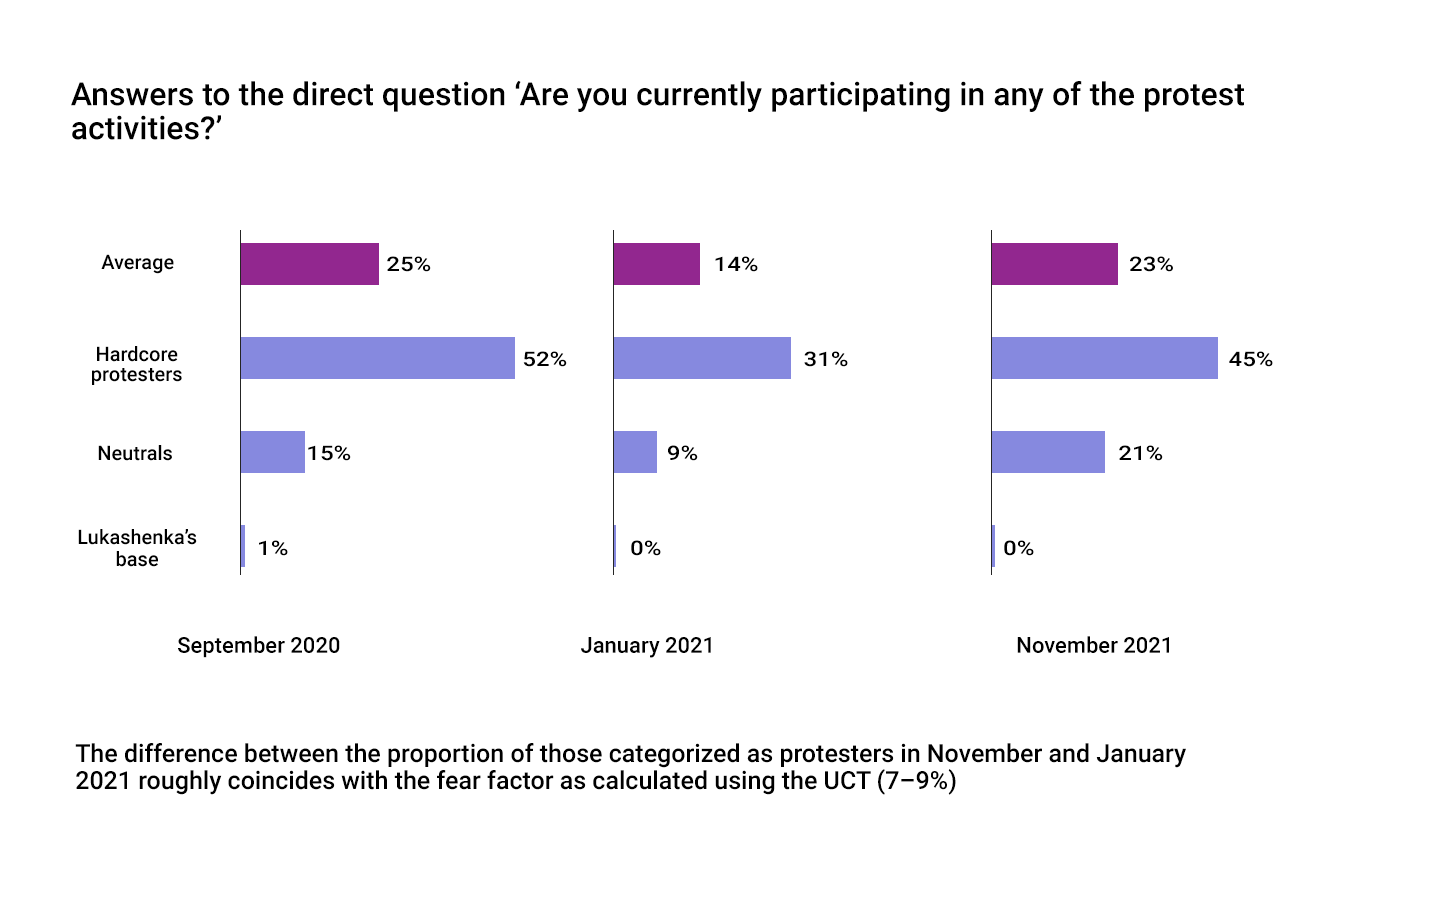
- In September 2020, a direct question was used to determine the proportion of participants in the protest; in November 2021 a randomized response technique (crosswise model) was used.
- In January 2021, to determine the proportion of those who participated, aggregated answers were used to the question about participation in one form or another of protest in August–October 2020 (the researchers defined ‘protest’ as encompassing the widest possible range of actions, from participation in courtyard tea parties and painting murals to taking part in protest marches).
- The dynamics of answers to direct questions confirms the increasing sensitivity of the topic and coincides with the dynamics of answers to questions about voting in elections.
Methodology

- Questions on the topic of political orientation and position regarding the authorities and the president, in the opinion of the respondents, could cause anxiety among the majority of other participants. Considering that the question is projective, it can be argued that the interviewees themselves experienced anxiety in 70–80% of cases, which could distort their answers.
- The most ‘worried’ segment in this regard is the neutrals. They are more likely to answer questions from a more neutral position than they really hold, due to feelings of insecurity and fear.
The fear factor is present in research on sociopolitical topics but it doesn't affect on the results significantly.
- The dynamics of answers to direct questions confirms the existence of certain fears among the survey respondents.
- The maximum possible distortion on individual issues that the Chatham 8–9%.
- A significant element of the differences observed between answers to direct questions and answers using special methods can be explained by several externals factors as a random sampling error or by participants in the online panel leaving the country after the events of 2020.
- The group most susceptible to fear are neutrals.
- Respondents in this segment more often assume that others might have answered the questionnaire questions insincerely, and they speak of greater nervousness when answering sensitive questions. At the same time, these people are more likely to shift the distribution of answers towards ‘neutral' options, such as ‘none of the above’, or ‘prefer not to say’. On scale questions, they will choose ‘fuzzy’ statements.
Conclusions
